

Table of Contents
- Understanding the Basics: Looker and Power BI
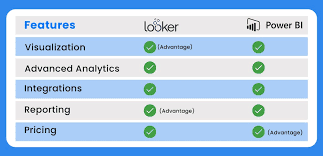
- Key Features and Functionalities
- User Experience and Usability
- Pricing and Licensing
- Deployment and Scalability
- Industry-Specific Applications: Looker vs Power BI
- Future Trends: Looker vs Power BI in 2025 and Beyond
- Making the Right Choice: Looker vs Power BI
In the ever-evolving landscape of data analytics, choosing the right business intelligence (BI) tool is crucial for data professionals. As we move into 2025, the debate between Looker and Power BI continues to intensify, with both platforms offering unique strengths and capabilities. This comprehensive comparison aims to provide you with the insights needed to make an informed decision between these two powerhouse BI tools.

Understanding the Basics: Looker and Power BI
Before diving into the intricacies of Looker vs Power BI, let's establish a foundational understanding of each platform.
Looker: The Google Cloud Powerhouse
Looker, now a part of Google Cloud, has evolved significantly since its acquisition in 2020. As of 2025, it stands as a formidable cloud-native business intelligence platform, known for its robust data modeling capabilities and seamless integration within the Google Cloud ecosystem.
Key Points:
- Cloud-native architecture
- Powerful data modeling with LookML
- Deep integration with Google Cloud Platform (GCP)
For a quick overview of Looker's latest features, check out this official Looker video.
Power BI: Microsoft's Versatile BI Solution
Power BI, Microsoft's flagship BI tool, has maintained its position as a user-friendly and versatile data visualization platform. In 2025, it continues to be a go-to choice for organizations heavily invested in the Microsoft ecosystem.
Key Points:
- Intuitive user interface
- Strong integration with Microsoft products
- Regular updates and community-driven improvements
To get a glimpse of Power BI's current capabilities, you can watch this Microsoft Power BI overview.
Key Features and Functionalities
When comparing Looker vs Power BI, it's essential to delve into their core features and functionalities. Let's explore how these two platforms stack up in various key areas.
Data Integration and Sources
Looker's Approach to Data Integration
Looker's strength lies in its ability to connect directly to your data warehouse, providing real-time access to your data without the need for extracting or moving it. This approach, known as the "data in place" philosophy, has several advantages:
- Reduced data latency
- Enhanced data security
- Simplified data governance
Looker supports a wide range of data sources, including:
- Google BigQuery
- Amazon Redshift
- Snowflake
- PostgreSQL
- MySQL
For organizations using multiple data sources, Looker's ability to create a unified view across different databases is particularly valuable. This feature, called "cross-database joins," allows for complex analyses that span various data repositories.
Power BI's Data Connectivity
Power BI takes a different approach, offering a vast array of pre-built connectors to various data sources. This flexibility is one of Power BI's strongest selling points, especially for organizations with diverse data ecosystems.
Key features of Power BI's data integration:
- Over 100 built-in data connectors
- Power Query for data transformation and cleaning
- Support for both cloud and on-premises data sources
Power BI's data refresh capabilities are also noteworthy. Users can schedule automatic refreshes, ensuring that dashboards and reports always reflect the most current data.
Visualization Capabilities
Looker's Visualization Toolkit
Looker's approach to data visualization emphasizes flexibility and customization. While it offers a standard set of visualization types, its real strength lies in the ability to create custom visualizations using HTML, CSS, and JavaScript.
Key visualization features in Looker:
- Drag-and-drop interface for basic chart creation
- Advanced customization options for developers
- Support for interactive and drill-down visualizations
Looker's visualization capabilities shine in scenarios requiring complex, data-driven visualizations that go beyond standard charts and graphs. For instance, its ability to create custom, interactive maps is particularly useful for geographic data analysis.
Power BI's Rich Visual Gallery
Power BI is renowned for its extensive library of visualizations and its user-friendly interface for creating them. The platform offers:
- A wide range of built-in visualizations
- Custom visual marketplace
- AI-powered visualization recommendations
Power BI's "Quick Insights" feature, which uses machine learning to automatically generate relevant visualizations, is particularly useful for users who may not have extensive data analysis experience.
Advanced Analytics and AI Integration
Looker's Analytical Capabilities
Looker has made significant strides in incorporating advanced analytics and AI into its platform. As of 2025, some key features include:
- Integration with Google Cloud AI services
- Support for Python and R for custom modeling
- Predictive analytics capabilities
Looker's strength in this area lies in its ability to seamlessly integrate advanced analytics into the data workflow, allowing data scientists and analysts to work collaboratively on the same platform.
Power BI's AI-Driven Insights
Microsoft has heavily invested in AI capabilities for Power BI, making it a strong contender in the realm of advanced analytics. Notable features include:
- AI-powered Q&A for natural language queries
- Automated machine learning for predictive modeling
- Integration with Azure Machine Learning
Power BI's AI features are particularly user-friendly, making advanced analytics accessible to users with varying levels of technical expertise.
User Experience and Usability
The user experience can make or break a BI tool's adoption within an organization. Let's explore how Looker and Power BI compare in this crucial aspect.
Learning Curve: Looker vs Power BI
Mastering Looker
Looker's learning curve is generally steeper, especially for users without a background in SQL or data modeling. The platform's power comes from its flexibility, but this can be intimidating for newcomers.
Key points:
- Requires understanding of LookML for advanced use
- Steeper learning curve for non-technical users
- Extensive documentation and training resources available
Despite the initial challenge, many users find that the investment in learning Looker pays off in terms of the depth and flexibility of analysis it enables.
Getting Started with Power BI
Power BI is known for its user-friendly interface and shallow learning curve, especially for users familiar with other Microsoft products.
Key points:
- Intuitive drag-and-drop interface
- Familiar Excel-like formulas for calculations
- Extensive online tutorials and community support
Power BI's accessibility makes it a popular choice for organizations looking to democratize data analysis across various departments.
Collaboration and Sharing Features
Looker's Collaborative Approach
Looker emphasizes collaboration throughout the data analysis process. Its features support:
- Real-time collaborative editing of dashboards
- Version control for data models
- Granular access controls for data governance
Looker's "Data Actions" feature, which allows users to write back to source systems directly from dashboards, is particularly useful for collaborative workflows.
Power BI's Sharing Capabilities
Power BI excels in sharing and distribution, especially within the Microsoft ecosystem. Key features include:
- Easy publishing to the Power BI service
- Integration with Microsoft Teams for in-app data sharing
- Mobile app for on-the-go access to reports and dashboards
Power BI's "Analyze in Excel" feature, which allows users to connect Excel directly to Power BI datasets, is a standout for organizations heavily reliant on Excel for analysis.
Pricing and Licensing
Understanding the cost implications of Looker vs Power BI is crucial for making an informed decision. Let's break down the pricing structures of both platforms.
Looker's Enterprise-Focused Pricing
Looker's pricing model is geared towards enterprise customers and is generally considered more expensive than Power BI. Key aspects of Looker's pricing include:
- Custom pricing based on number of users and data volume
- Annual contracts with volume discounts available
- Additional costs for specific features or integrations
While Looker doesn't publicly disclose its pricing, it's important to note that the investment often pays off for organizations requiring advanced data modeling and analytics capabilities.
Power BI's Flexible Pricing Tiers
Power BI offers a more transparent and flexible pricing structure, catering to a wide range of organization sizes and needs:
- Power BI Pro: $9.99 per user per month (as of 2025)
- Power BI Premium: Starting at $4,995 per dedicated cloud compute and storage resource
Power BI also offers a free tier with limited features, making it accessible for small businesses or individual users to get started.
Deployment and Scalability
As data volumes grow and organizational needs evolve, the ability to scale and adapt your BI solution becomes crucial. Let's examine how Looker and Power BI handle deployment and scalability.
Looker's Cloud-Native Architecture
Looker's cloud-native design provides several advantages when it comes to deployment and scalability:
- Seamless integration with cloud data warehouses
- Automatic updates and maintenance
- Elastic scalability to handle growing data volumes
Looker's architecture is particularly well-suited for organizations with large, complex datasets that require real-time analysis.
Power BI's Flexible Deployment Options
Power BI offers more flexibility in terms of deployment, catering to both cloud and on-premises needs:
- Cloud deployment through Power BI Service
- On-premises deployment with Power BI Report Server
- Hybrid options for organizations transitioning to the cloud
This flexibility makes Power BI an attractive option for organizations with specific regulatory or data residency requirements.
Industry-Specific Applications: Looker vs Power BI
Both Looker and Power BI have found applications across various industries. Let's explore some industry-specific use cases to understand how these tools perform in different sectors.
Looker in E-commerce and Retail
Looker has gained significant traction in the e-commerce and retail sectors, thanks to its ability to handle large volumes of transactional data and provide real-time insights.
Key applications:
- Customer segmentation and behavior analysis
- Inventory management and supply chain optimization
- Real-time sales performance tracking
For example, a major online retailer uses Looker to analyze customer browsing patterns and purchase history, enabling personalized product recommendations and targeted marketing campaigns.
Power BI in Healthcare
Power BI has found strong adoption in the healthcare industry, particularly for its ease of use and compliance features.
Key applications:
- Patient data analysis and outcome prediction
- Hospital resource management
- Compliance reporting and data governance
A notable case study is a large hospital network that uses Power BI to track patient readmission rates and identify factors contributing to improved patient outcomes.
Financial Services: Looker vs Power BI
Both platforms have made significant inroads in the financial services sector, each offering unique advantages.
Looker's strengths in financial services:
- Complex data modeling for risk analysis
- Real-time fraud detection
- Regulatory reporting and compliance
Power BI's advantages in finance:
- Integration with Microsoft Excel for financial modeling
- User-friendly dashboards for executive reporting
- Cost-effective solutions for smaller financial institutions
A major investment bank, for instance, uses Looker for its advanced risk modeling capabilities, while a regional credit union might opt for Power BI due to its lower cost and ease of use.
Future Trends: Looker vs Power BI in 2025 and Beyond
As we look towards the future, both Looker and Power BI are evolving to meet the changing needs of data professionals. Let's explore some of the trends shaping these platforms in 2025 and beyond.
Looker's Evolution
Looker is doubling down on its strengths in data modeling and cloud integration:
- Enhanced AI and machine learning capabilities through deeper integration with Google Cloud AI
- Expanded support for real-time streaming data analysis
- Improved natural language processing for data querying
These advancements position Looker as a powerful tool for organizations looking to leverage advanced analytics and AI in their decision-making processes.
Power BI's Roadmap
Microsoft continues to innovate with Power BI, focusing on:
- Expanded AI-driven insights and automated reporting
- Enhanced data governance and security features
- Improved integration with the broader Microsoft ecosystem, including Azure Synapse Analytics
Power BI's future developments aim to make advanced analytics more accessible to a wider range of users within organizations.
Emerging Trends in BI
Both platforms are adapting to broader trends in the BI landscape:
- Increased focus on data storytelling and narrative-driven analytics
- Enhanced support for IoT and edge computing data sources
- Greater emphasis on data ethics and responsible AI
As these trends evolve, we can expect both Looker and Power BI to continue adapting their features and capabilities to meet the changing needs of data professionals.
Making the Right Choice: Looker vs Power BI
After this comprehensive comparison, you might be wondering which tool is right for your organization. The truth is, there's no one-size-fits-all answer. The choice between Looker and Power BI depends on your specific needs, existing technology stack, and organizational culture.
When to Choose Looker
Consider Looker if:
- Your organization heavily relies on Google Cloud Platform
- You need advanced data modeling capabilities
- Real-time analytics on large datasets is a priority
- You have a team of data analysts comfortable with SQL and willing to learn LookML
Looker excels in scenarios requiring complex data modeling and analysis, making it ideal for data-driven organizations with sophisticated analytical needs.
When to Choose Power BI
Power BI might be the better choice if:
- Your organization is already invested in the Microsoft ecosystem
- You need an easy-to-use tool accessible to non-technical users
- Cost-effectiveness is a primary concern
- You require flexible deployment options (cloud, on-premises, or hybrid)
Power BI's strength lies in its accessibility and integration with Microsoft products, making it a great choice for organizations looking to democratize data analysis.
Final Thoughts
Both Looker and Power BI are powerful BI tools that continue to evolve and improve. As you make your decision, consider:
- Your organization's current and future data analytics needs
- The technical skills of your team
- Your budget and licensing preferences
- The importance of integration with your existing technology stack
Remember, the best BI tool is the one that empowers your team to make data-driven decisions effectively. Whether you choose Looker or Power BI, investing time in proper implementation and training will be key to realizing the full potential of your chosen platform.
As the data landscape continues to evolve, stay informed about the latest developments in both platforms. The right choice today may need to be re-evaluated as your organization's needs change and new features become available.
Ultimately, the goal is to select a tool that not only meets your current requirements but also positions your organization for future success in the data-driven world of 2025 and beyond.