

Table of Contents
- Introduction to Tableau in 2025
- Getting Started with Tableau
- Advanced Tableau Features and Techniques
- Integrating Tableau with Other Tools
- Best Practices for Effective Data Visualization
- Tableau for Different Industries
- Conclusion
- FAQ
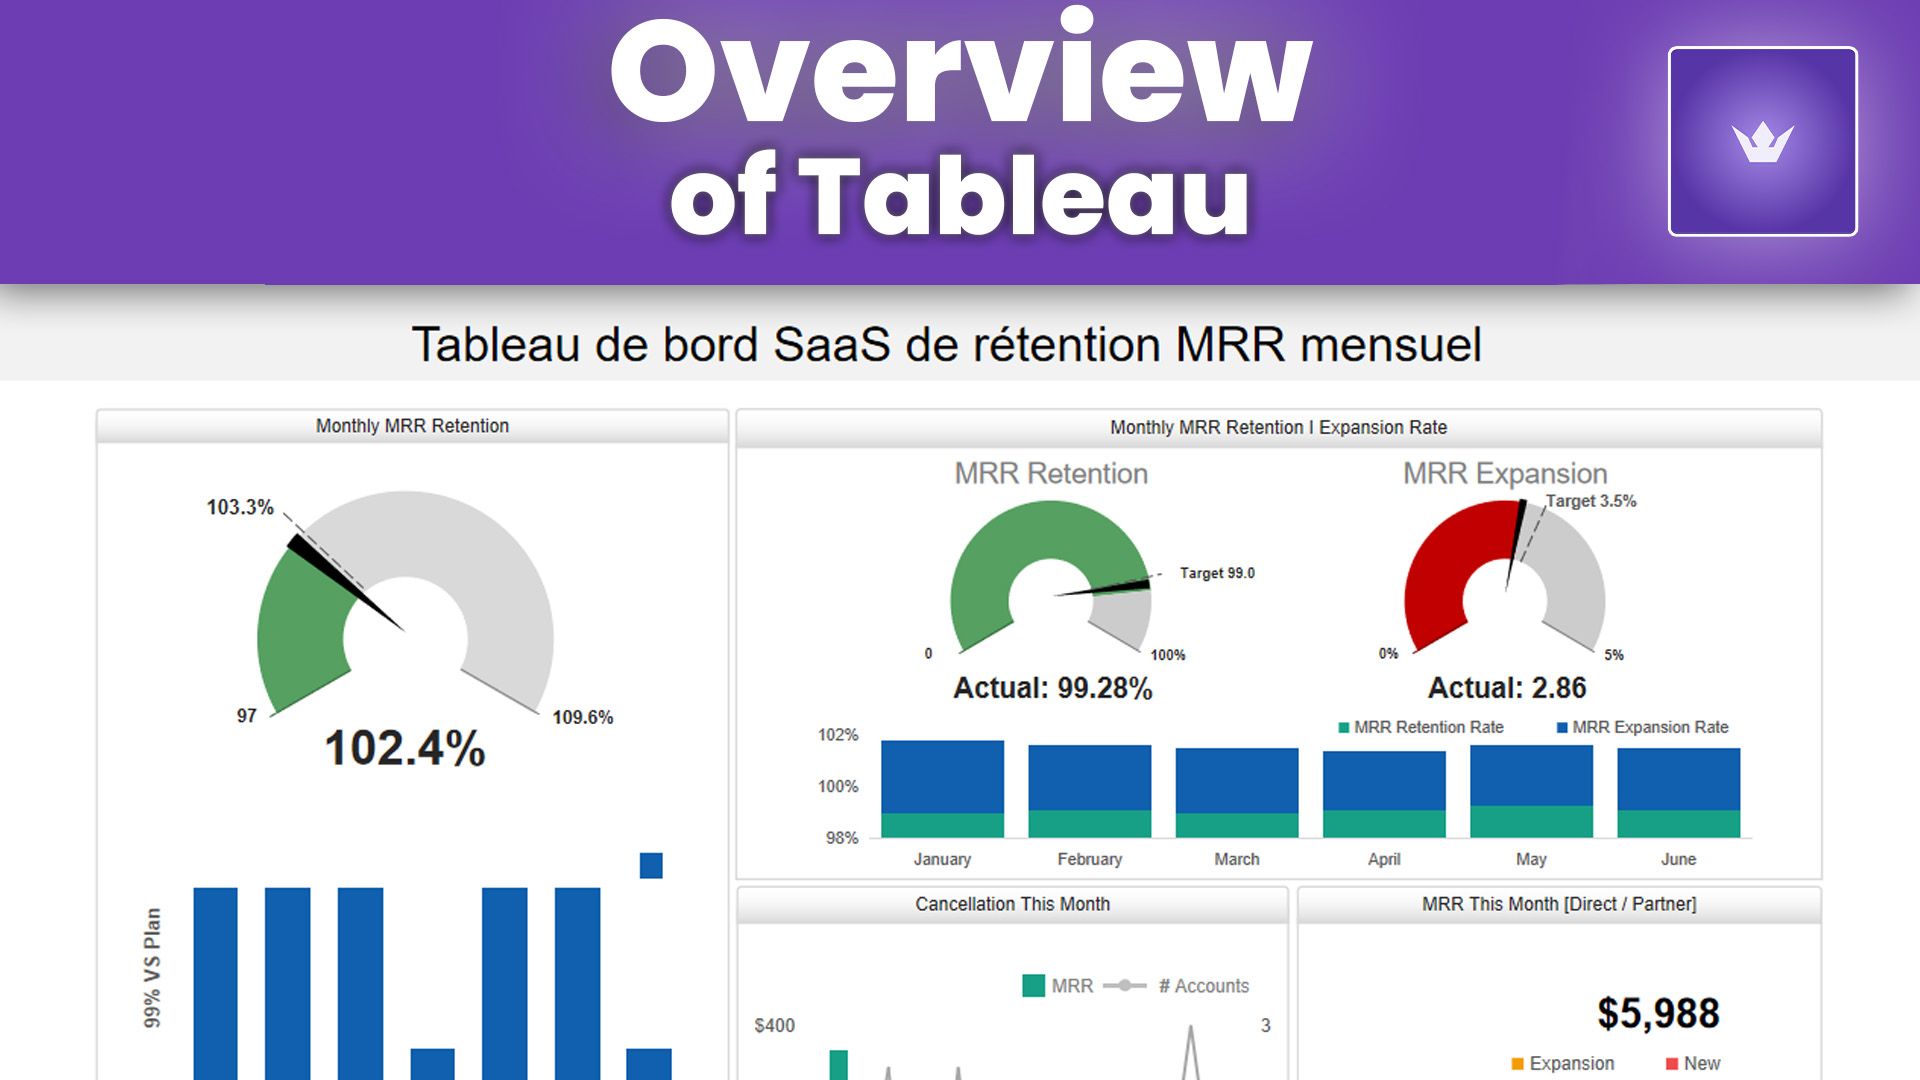
Introduction to Tableau in 2025
In the ever-evolving landscape of data analytics, Tableau has maintained its position as a leading data visualization tool. As we navigate through 2025, the importance of transforming raw data into actionable insights has never been more critical. Tableau stands at the forefront of this revolution, offering users an intuitive platform to explore, analyze, and present data in compelling visual formats.
Tableau's user-friendly interface, combined with its powerful analytical capabilities, makes it an invaluable asset for businesses, researchers, and data enthusiasts alike. Whether you're a seasoned data analyst or just beginning your journey into the world of data visualization, learning how to use Tableau effectively can significantly enhance your ability to make data-driven decisions.
In this comprehensive guide, we'll explore the latest features of Tableau, walk you through the process of creating stunning visualizations, and provide tips and tricks to maximize your use of this versatile tool. Let's dive into the world of Tableau and unlock the potential of your data!
Getting Started with Tableau
Downloading and Installing Tableau
To begin your Tableau journey, you'll need to download and install the software. As of 2025, Tableau offers various products, including Tableau Desktop, Tableau Server, and Tableau Online. For most individual users, Tableau Desktop is the go-to choice.
- Visit the official Tableau website: Tableau.com
- Navigate to the 'Products' section and choose Tableau Desktop
- Follow the installation instructions for your operating system
Understanding the Tableau Interface
Once installed, launch Tableau Desktop. You'll be greeted with a clean, intuitive interface. Here are the key components:
- Data Source Pane: Where you connect to and manage your data sources
- Sheets Tab: Your workspace for creating individual visualizations
- Dashboards Tab: Where you combine multiple visualizations
- Story Tab: For creating interactive, guided presentations of your data
- Shelves and Cards: Areas where you place fields to construct your visualization
Connecting to Data Sources
Tableau supports a wide range of data sources, from local files to cloud databases. To connect to a data source:
- Click on 'Connect to Data' on the start page
- Choose your data source type (e.g., Excel, SQL database, web data connector)
- Navigate to your file or enter the necessary connection details
- Once connected, you can start exploring your data in the Data Source page
Creating Your First Visualization
Let's create a simple bar chart to get you started:
- Drag a dimension (e.g., 'Category') to the Columns shelf
- Drag a measure (e.g., 'Sales') to the Rows shelf
- Tableau will automatically create a bar chart
- Experiment with different chart types using the 'Show Me' feature in the top right corner
Advanced Tableau Features and Techniques
As you become more comfortable with Tableau, you'll want to explore its advanced features to create more complex and insightful visualizations.
Using Calculated Fields
Calculated fields allow you to create new data points based on existing fields in your data source.
- Right-click in the Data pane and select 'Create Calculated Field'
- Name your field and enter the calculation (e.g., [Profit] / [Sales] for profit ratio)
- Use this new field in your visualizations for deeper insights
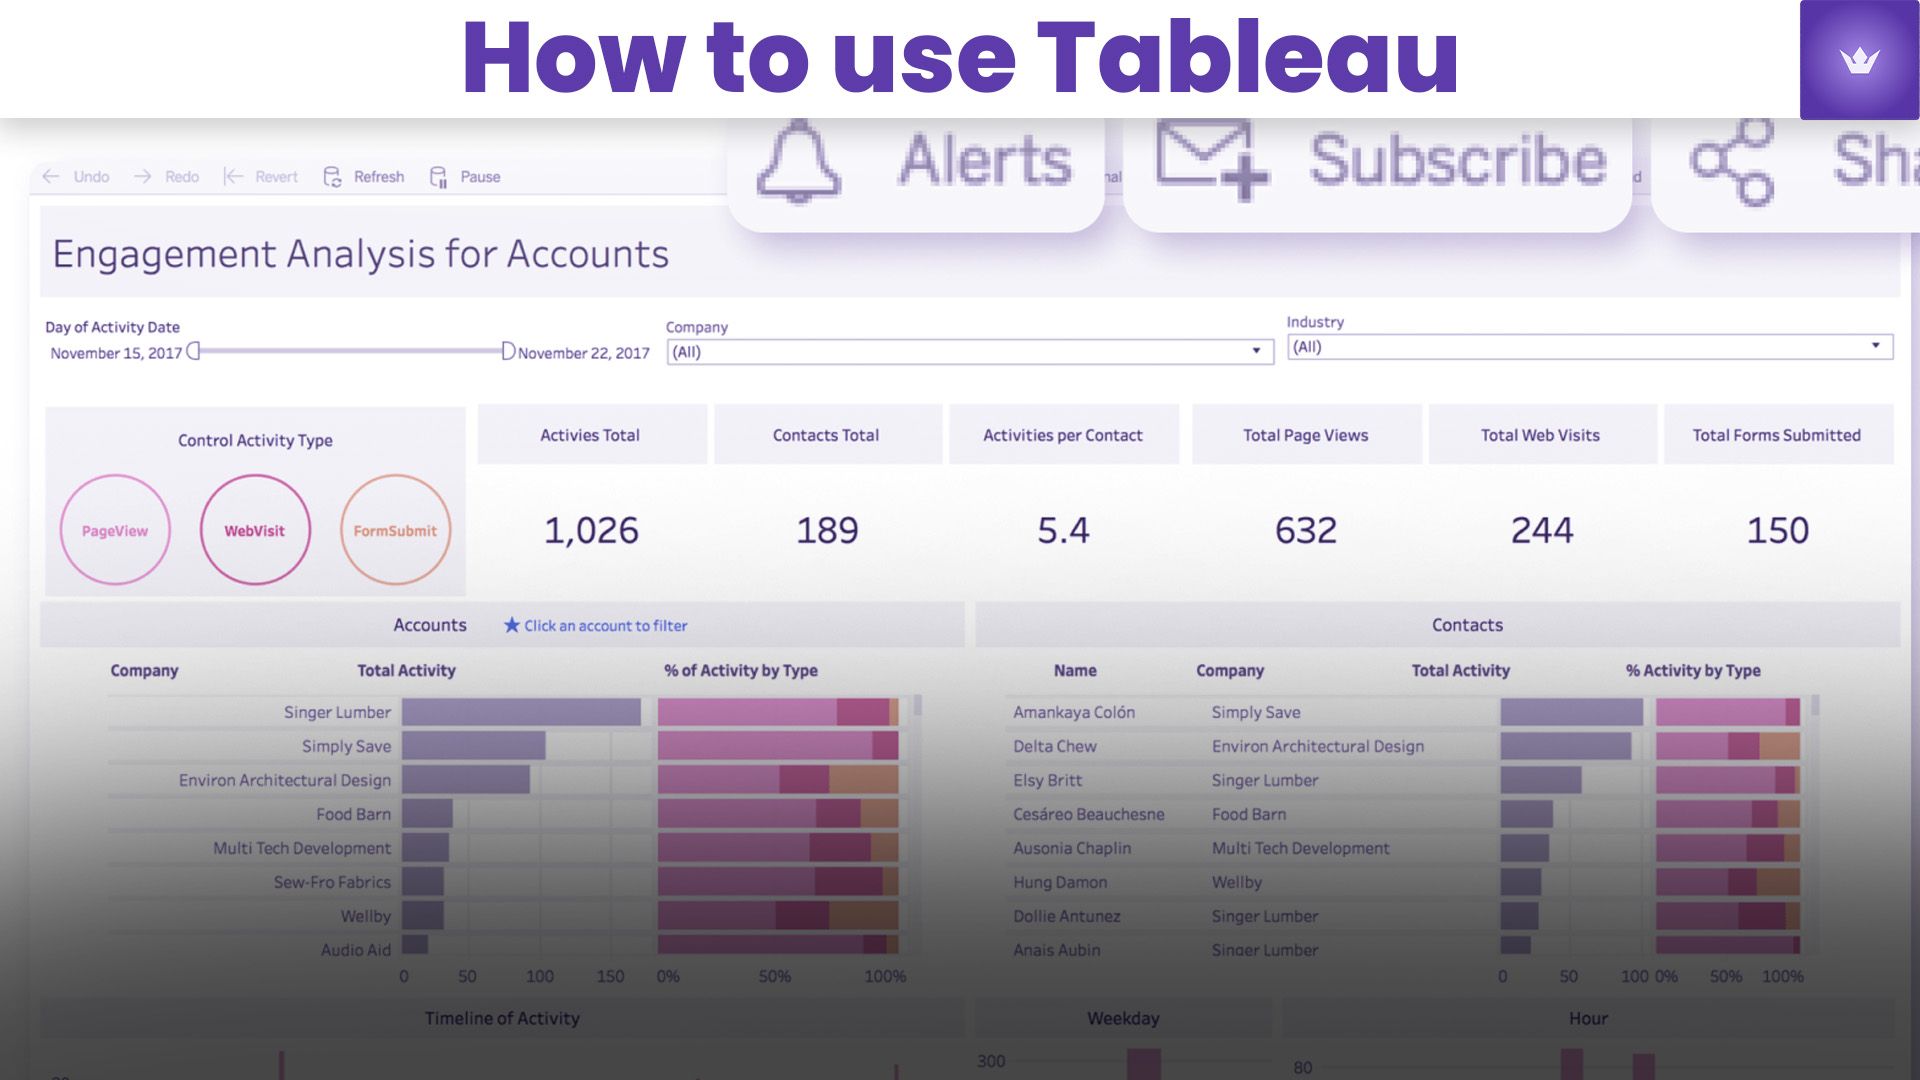
Creating Interactive Dashboards
Dashboards combine multiple visualizations into a single view, often with interactive elements.
- Go to the Dashboard tab
- Drag sheets (individual visualizations) onto the dashboard
- Add interactive elements like filters and actions
- Adjust the layout and formatting to create a cohesive design
Leveraging Parameters for User Interactivity
Parameters allow users to interact with your visualizations dynamically.
- Right-click in the Data pane and select 'Create Parameter'
- Define the parameter settings (e.g., a list of product categories)
- Create a calculated field that uses the parameter
- Add a parameter control to your dashboard for user interaction
Mastering Table Calculations
Table calculations perform computations on the values in your visualization.
- Add a measure to your visualization
- Right-click on the measure and select 'Add Table Calculation'
- Choose from predefined calculations or create a custom one
- Adjust the computation settings as needed
Integrating Tableau with Other Tools
In 2025, the ability to integrate Tableau with other data tools and platforms is more important than ever. Here are some key integrations to consider:
Tableau and Python/R Integration
Tableau now offers seamless integration with Python and R, allowing for advanced analytics directly within your visualizations.
- Enable TabPy (Tableau Python Server) or RServe
- Create calculated fields using Python or R scripts
- Leverage machine learning models and complex statistical analyses in your dashboards
Connecting Tableau to Cloud Platforms
With the rise of cloud computing, Tableau has enhanced its connectivity to major cloud platforms.
- Amazon Web Services (AWS): Direct connection to Amazon Redshift, S3, and other AWS services
- Google Cloud Platform: Seamless integration with BigQuery and other GCP data services
- Microsoft Azure: Connect to Azure SQL Database, Synapse Analytics, and more
Tableau and Big Data
Tableau's capabilities in handling big data have significantly improved:
- Support for Hadoop distributions like Cloudera and Hortonworks
- Integration with Apache Spark for fast, large-scale data processing
- Ability to connect to NoSQL databases like MongoDB
Best Practices for Effective Data Visualization
To truly master Tableau, it's essential to understand and apply best practices in data visualization.
Choose the Right Chart Type
Select the most appropriate chart type for your data and the story you want to tell:
- Bar charts for comparing categories
- Line charts for showing trends over time
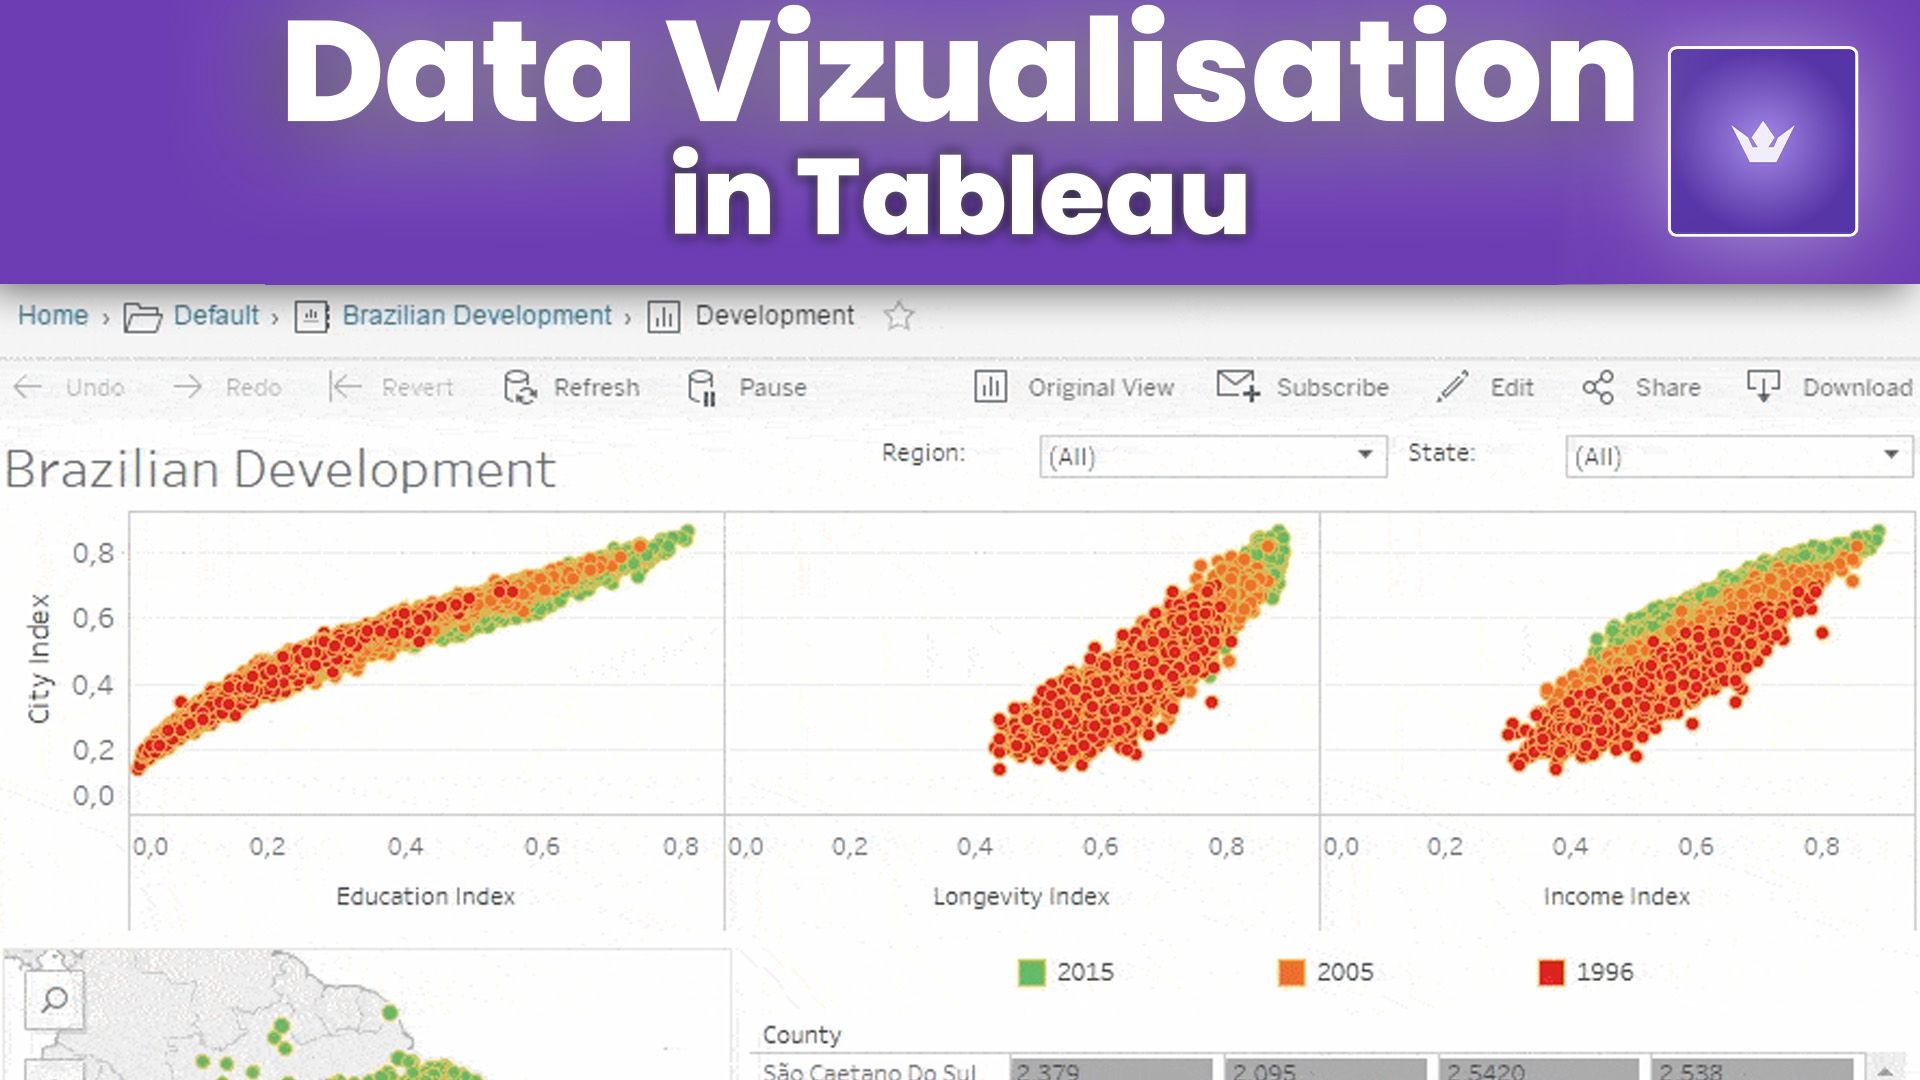
- Scatter plots for examining relationships between variables
- Maps for geographical data
Use Color Effectively
Color can enhance your visualizations, but use it judiciously:
- Use a consistent color palette throughout your dashboard
- Apply color to highlight important data points
- Consider color-blindness when choosing your palette
Keep It Simple and Clear
Avoid cluttering your visualizations:
- Remove unnecessary gridlines and borders
- Use clear, legible fonts
- Limit the number of elements in a single visualization
Tell a Story with Your Data
Structure your dashboard to guide the viewer through your insights:
- Start with an overview, then provide details
- Use text boxes to provide context and explanations
- Create a logical flow of information across your dashboard
Tableau for Different Industries
Tableau's versatility makes it valuable across various industries. Here's how different sectors are leveraging Tableau in 2025:
Finance and Banking
- Risk assessment visualizations
- Real-time trading dashboards
- Customer segmentation analysis
Healthcare
- Patient outcome tracking
- Hospital resource management
- Epidemiological data mapping
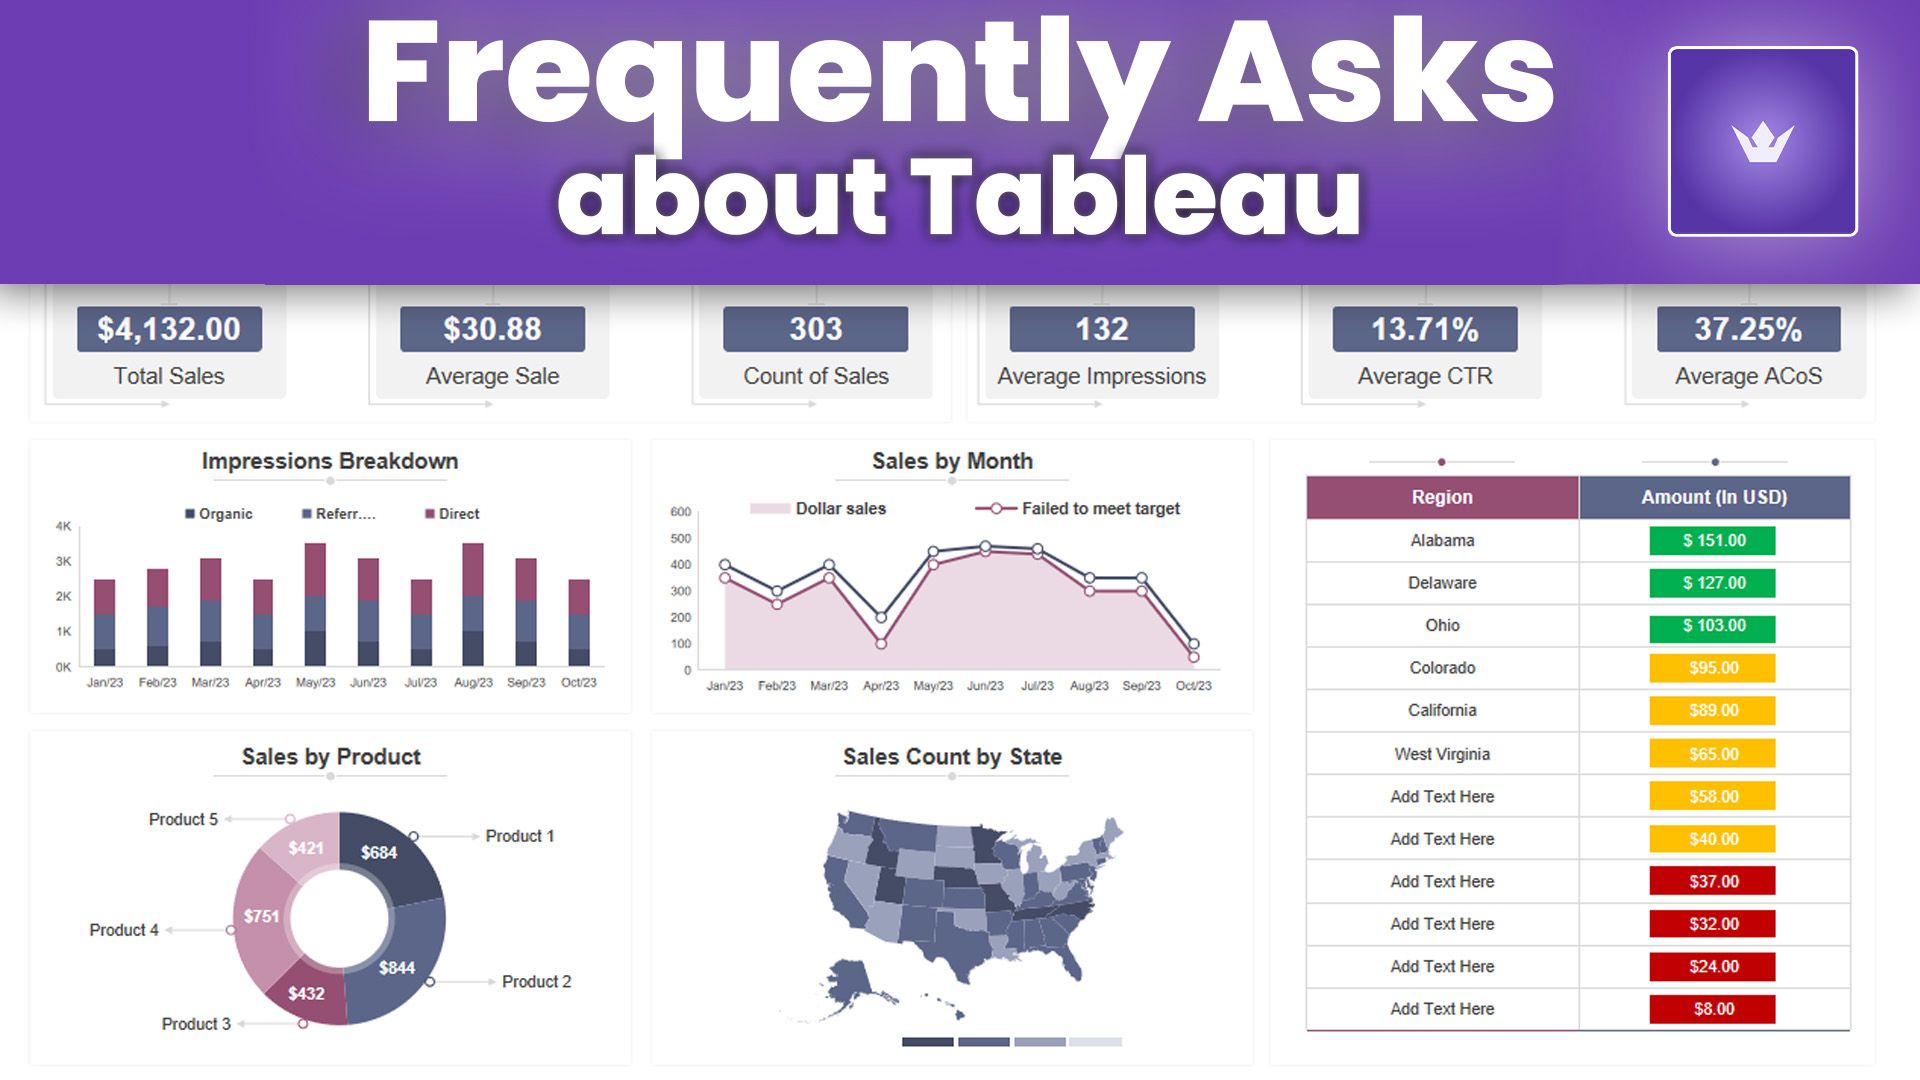
Retail and E-commerce
- Sales performance dashboards
- Customer behavior analysis
- Inventory optimization visualizations
Education
- Student performance tracking
- Enrollment trend analysis
- Research output visualizations
Manufacturing
- Production efficiency dashboards
- Supply chain optimization
- Quality control visualizations
Each industry has unique data visualization needs, and Tableau's flexibility allows it to adapt to these diverse requirements.
Conclusion
Mastering Tableau in 2025 opens up a world of possibilities for data analysis and visualization. From creating basic charts to developing complex, interactive dashboards, Tableau provides the tools you need to turn data into actionable insights.
Remember, the key to becoming proficient in Tableau is practice. Experiment with different data sets, explore new features, and challenge yourself to create more sophisticated visualizations. As you continue to use Tableau, you'll discover new ways to uncover and communicate the stories hidden in your data.
Whether you're a business analyst, a data scientist, or simply someone passionate about data, Tableau is an invaluable tool in your analytical arsenal. So dive in, explore, and let your data come to life with Tableau!
Ready to take your Tableau skills to the next level? Start by recreating one of your existing reports in Tableau, or explore the vast library of resources available on Tableau's official website. The journey to becoming a Tableau expert starts now!
FAQ
What are the system requirements for running Tableau in 2025?
As of 2025, Tableau Desktop requires a minimum of 8GB RAM (16GB recommended), 1.5GB of free disk space, and a 64-bit version of Windows 10 or higher, or macOS 10.15 or higher. For the most up-to-date requirements, always check the official Tableau website.
Can I use Tableau for free?
Tableau offers a free trial for its Desktop version. Additionally, Tableau Public is a free version that allows you to create and share visualizations publicly. However, for professional use with private data, a paid license is typically required.
How often does Tableau release updates?
Tableau typically releases major updates quarterly, with minor updates and patches released more frequently. It's recommended to keep your Tableau software up-to-date to access the latest features and security improvements.
Is it possible to collaborate on Tableau projects with my team?
Yes, Tableau offers collaboration features through Tableau Server and Tableau Online. These platforms allow teams to share dashboards, data sources, and workbooks securely within their organization.
Can Tableau handle real-time data?
Tableau supports real-time data connections to various databases and data streams. With live connections, your visualizations can automatically update as new data becomes available, enabling real-time analytics and monitoring.
How does Tableau compare to other data visualization tools in 2025?
While there are many data visualization tools available, Tableau remains a leader due to its user-friendly interface, powerful analytical capabilities, and extensive integration options. It excels in creating interactive, shareable dashboards and its ability to handle large datasets efficiently.